Monitoring Guide
Materialization jobs orchestrated by Tecton can be monitored and debugged using the Tecton Web UI, SDK, and CLI in case of failures.
Retry Strategy for Failing Jobs
Tecton will automatically retry failing jobs with different policies based on the failure: - Failures due to expected reasons such as an AWS spot instances being reclaimed are retried immediately. - Otherwise, the job will be retried after 5 minutes, with exponential backoff for each successive failure.
Jobs that will be retried are shown in the Web UI as Retrying (in X minutes).
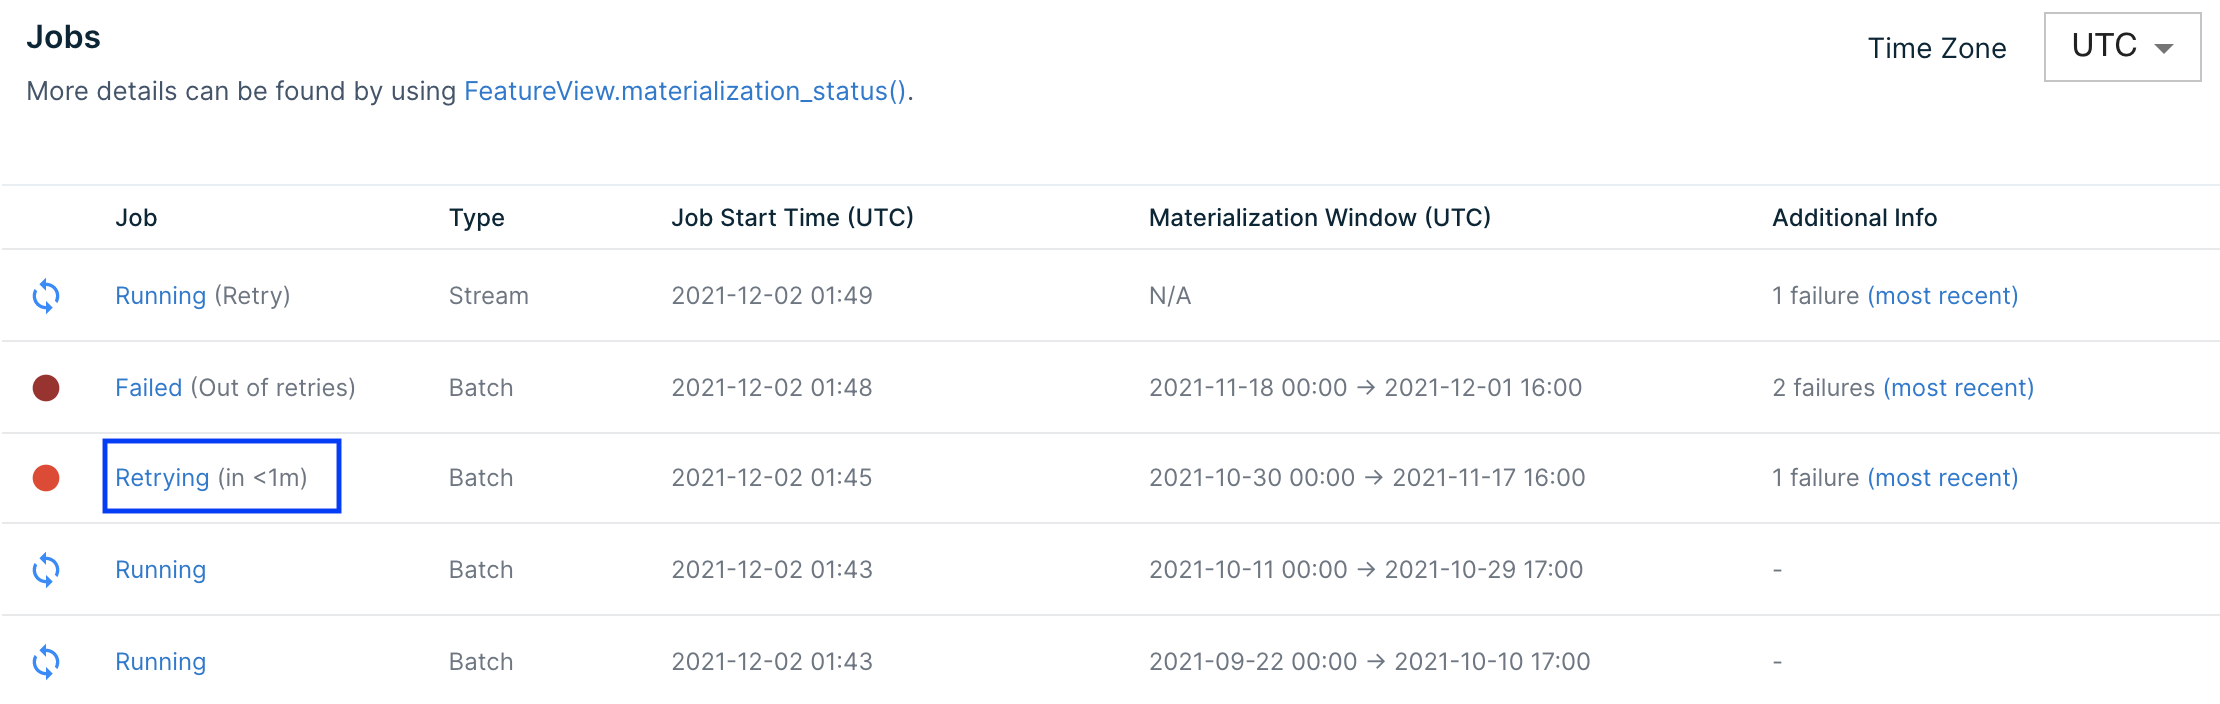
If a job fails too many times, auto-retries will stop and jobs will be labeled Failed in the Web UI. This happens after 100 attempts for spot instance-related failures or 10 attempts for other failures.
Manually Retrying Jobs
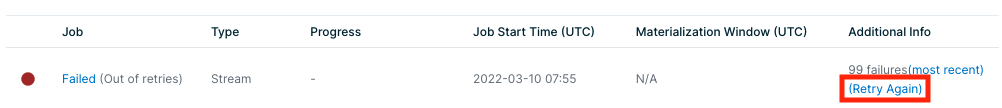
Materialized Jobs that fail repeatedly will eventually stop retrying. At this stage they can be manually retried. When you are ready to retry the failed job (e.g. after fixing the cause of the failures), trigger a manual retry of the job by clicking the (Retry Again) link in the Additional Info column of the failed job:
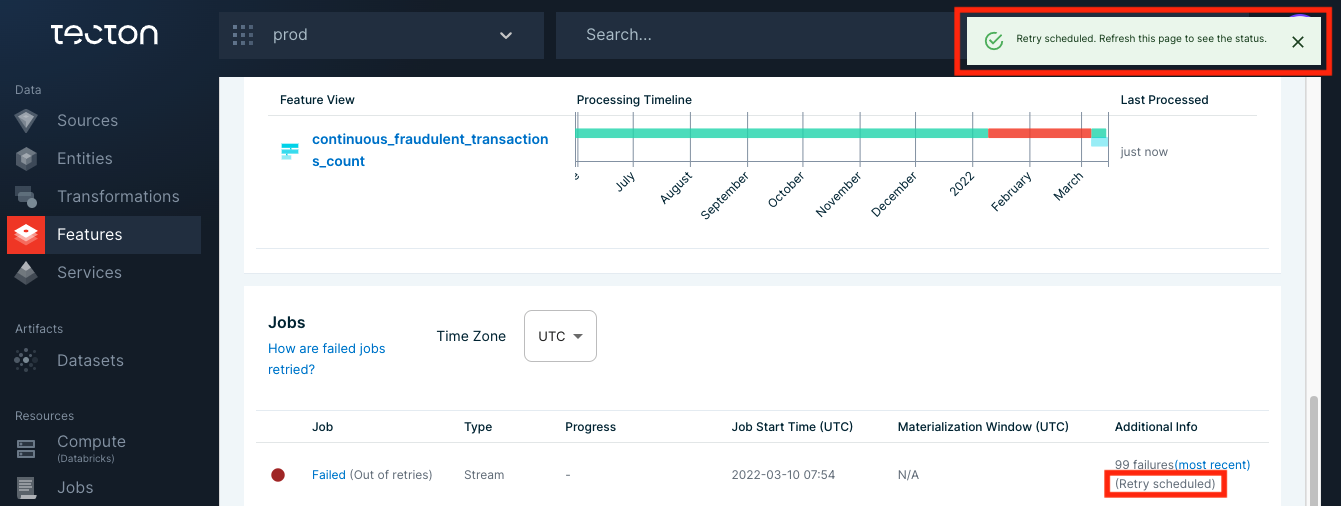
A notification will appear when the retry has been successfully scheduled. This happens immediately:
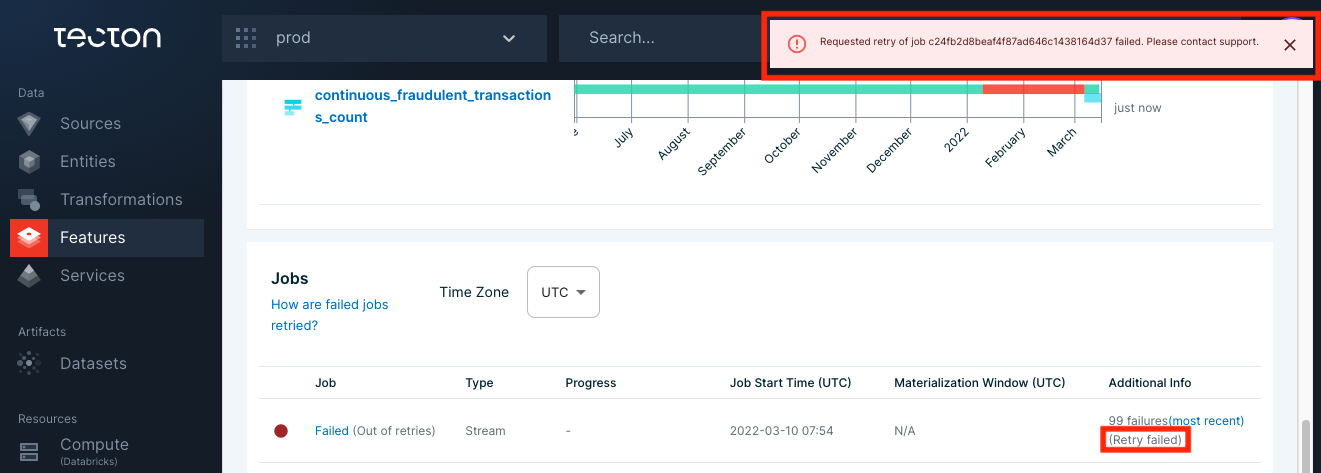
If the scheduling of the retry fails, the notification will give you a job ID, and you can contact support with the message:
Monitoring Failures
Tecton provides tools to monitor and debug materialized Feature Views using the Web UI, SDK, and CLI.
Web UI: Materialization Tab
The easiest way to check the health of a materialized Feature View is using the Web UI. Navigate to the Feature View in the Web UI and select the Materialization tab to see Feature View materialization information at a glance.
SDK: materialization_status()
Tecton's SDK provides a materialization_status() method on Feature View objects that returns details about materialization attempts.
import tecton

fv = tecton.get_workspace('my_space').get_feature_view('my_fv')
fv.materialization_status()
>>> All the displayed times are in UTC time zone
TYPE     WINDOW_START_TIME      WINDOW_END_TIME     STATUS    ATTEMPT_NUMBER     JOB_CREATED_AT      JOB_LOGS
================================================================================================================
BATCH   2021-12-15 00:00:00   2021-12-22 00:00:00   SUCCESS         1          2021-12-22 00:00:27   https://...
BATCH   2021-12-14 00:00:00   2021-12-21 00:00:00   SUCCESS         1          2021-12-21 00:00:14   https://...
BATCH   2021-12-13 00:00:00   2021-12-20 00:00:00   SUCCESS         1          2021-12-20 00:00:13   https://...
BATCH   2021-12-12 00:00:00   2021-12-19 00:00:00   SUCCESS         1          2021-12-19 00:00:10   https://...
BATCH   2021-12-11 00:00:00   2021-12-18 00:00:00   SUCCESS         1          2021-12-18 00:00:06   https://...
CLI: materialization-status
You can also use the tecton materialization-status $FV_NAME to see the materialization status of a specific Feature View.
$ tecton materialization-status my_feature_view
All the displayed times are in UTC time zone
TYPE     WINDOW_START_TIME      WINDOW_END_TIME     STATUS    ATTEMPT_NUMBER     JOB_CREATED_AT      JOB_LOGS
================================================================================================================
BATCH   2021-12-15 00:00:00   2021-12-22 00:00:00   SUCCESS         1          2021-12-22 00:00:27   https://...
BATCH   2021-12-14 00:00:00   2021-12-21 00:00:00   SUCCESS         1          2021-12-21 00:00:14   https://...
BATCH   2021-12-13 00:00:00   2021-12-20 00:00:00   SUCCESS         1          2021-12-20 00:00:13   https://...
BATCH   2021-12-12 00:00:00   2021-12-19 00:00:00   SUCCESS         1          2021-12-19 00:00:10   https://...
BATCH   2021-12-11 00:00:00   2021-12-18 00:00:00   SUCCESS         1          2021-12-18 00:00:06   https://...
Monitoring Feature Freshness
Feature Views can serve stale data for many reasons such as failed materialization jobs, late-arriving data, and under-provisioned streams. Feature freshness can be monitored using the Web UI.
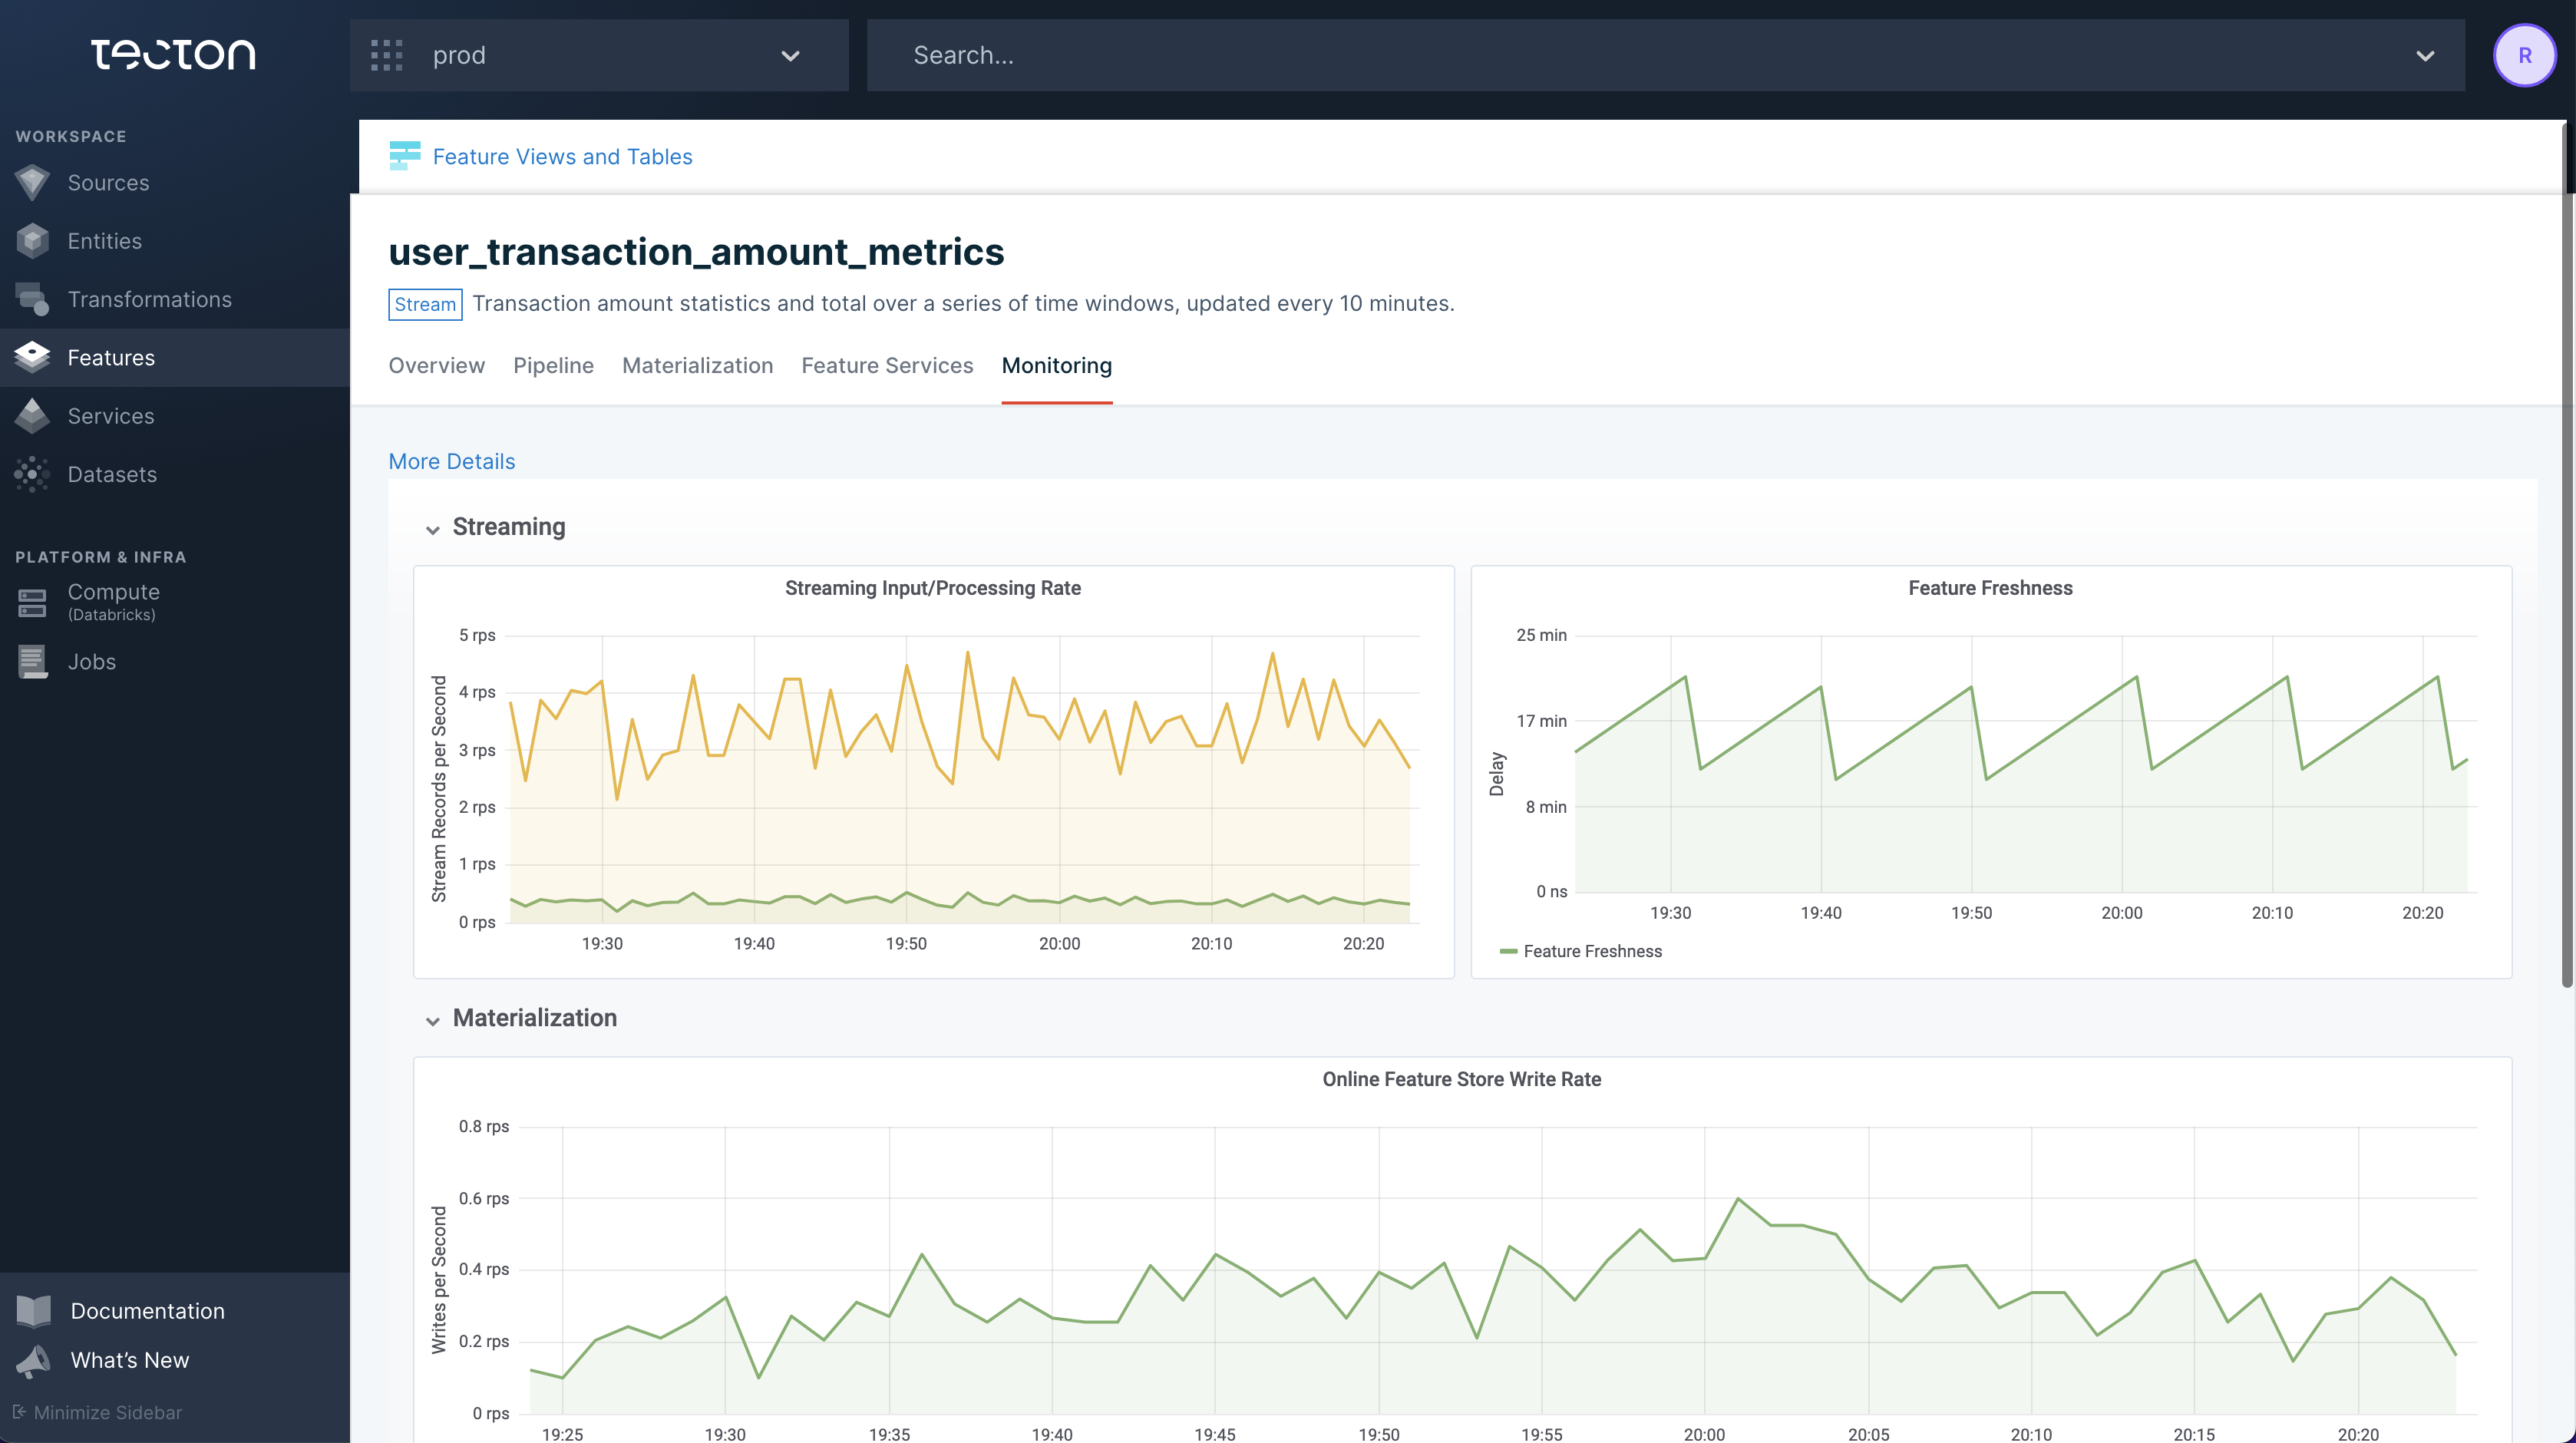
Web UI: Monitoring tab
The Monitoring tab for a Feature view contains freshness monitoring charts for any Feature View with materialization enabled.
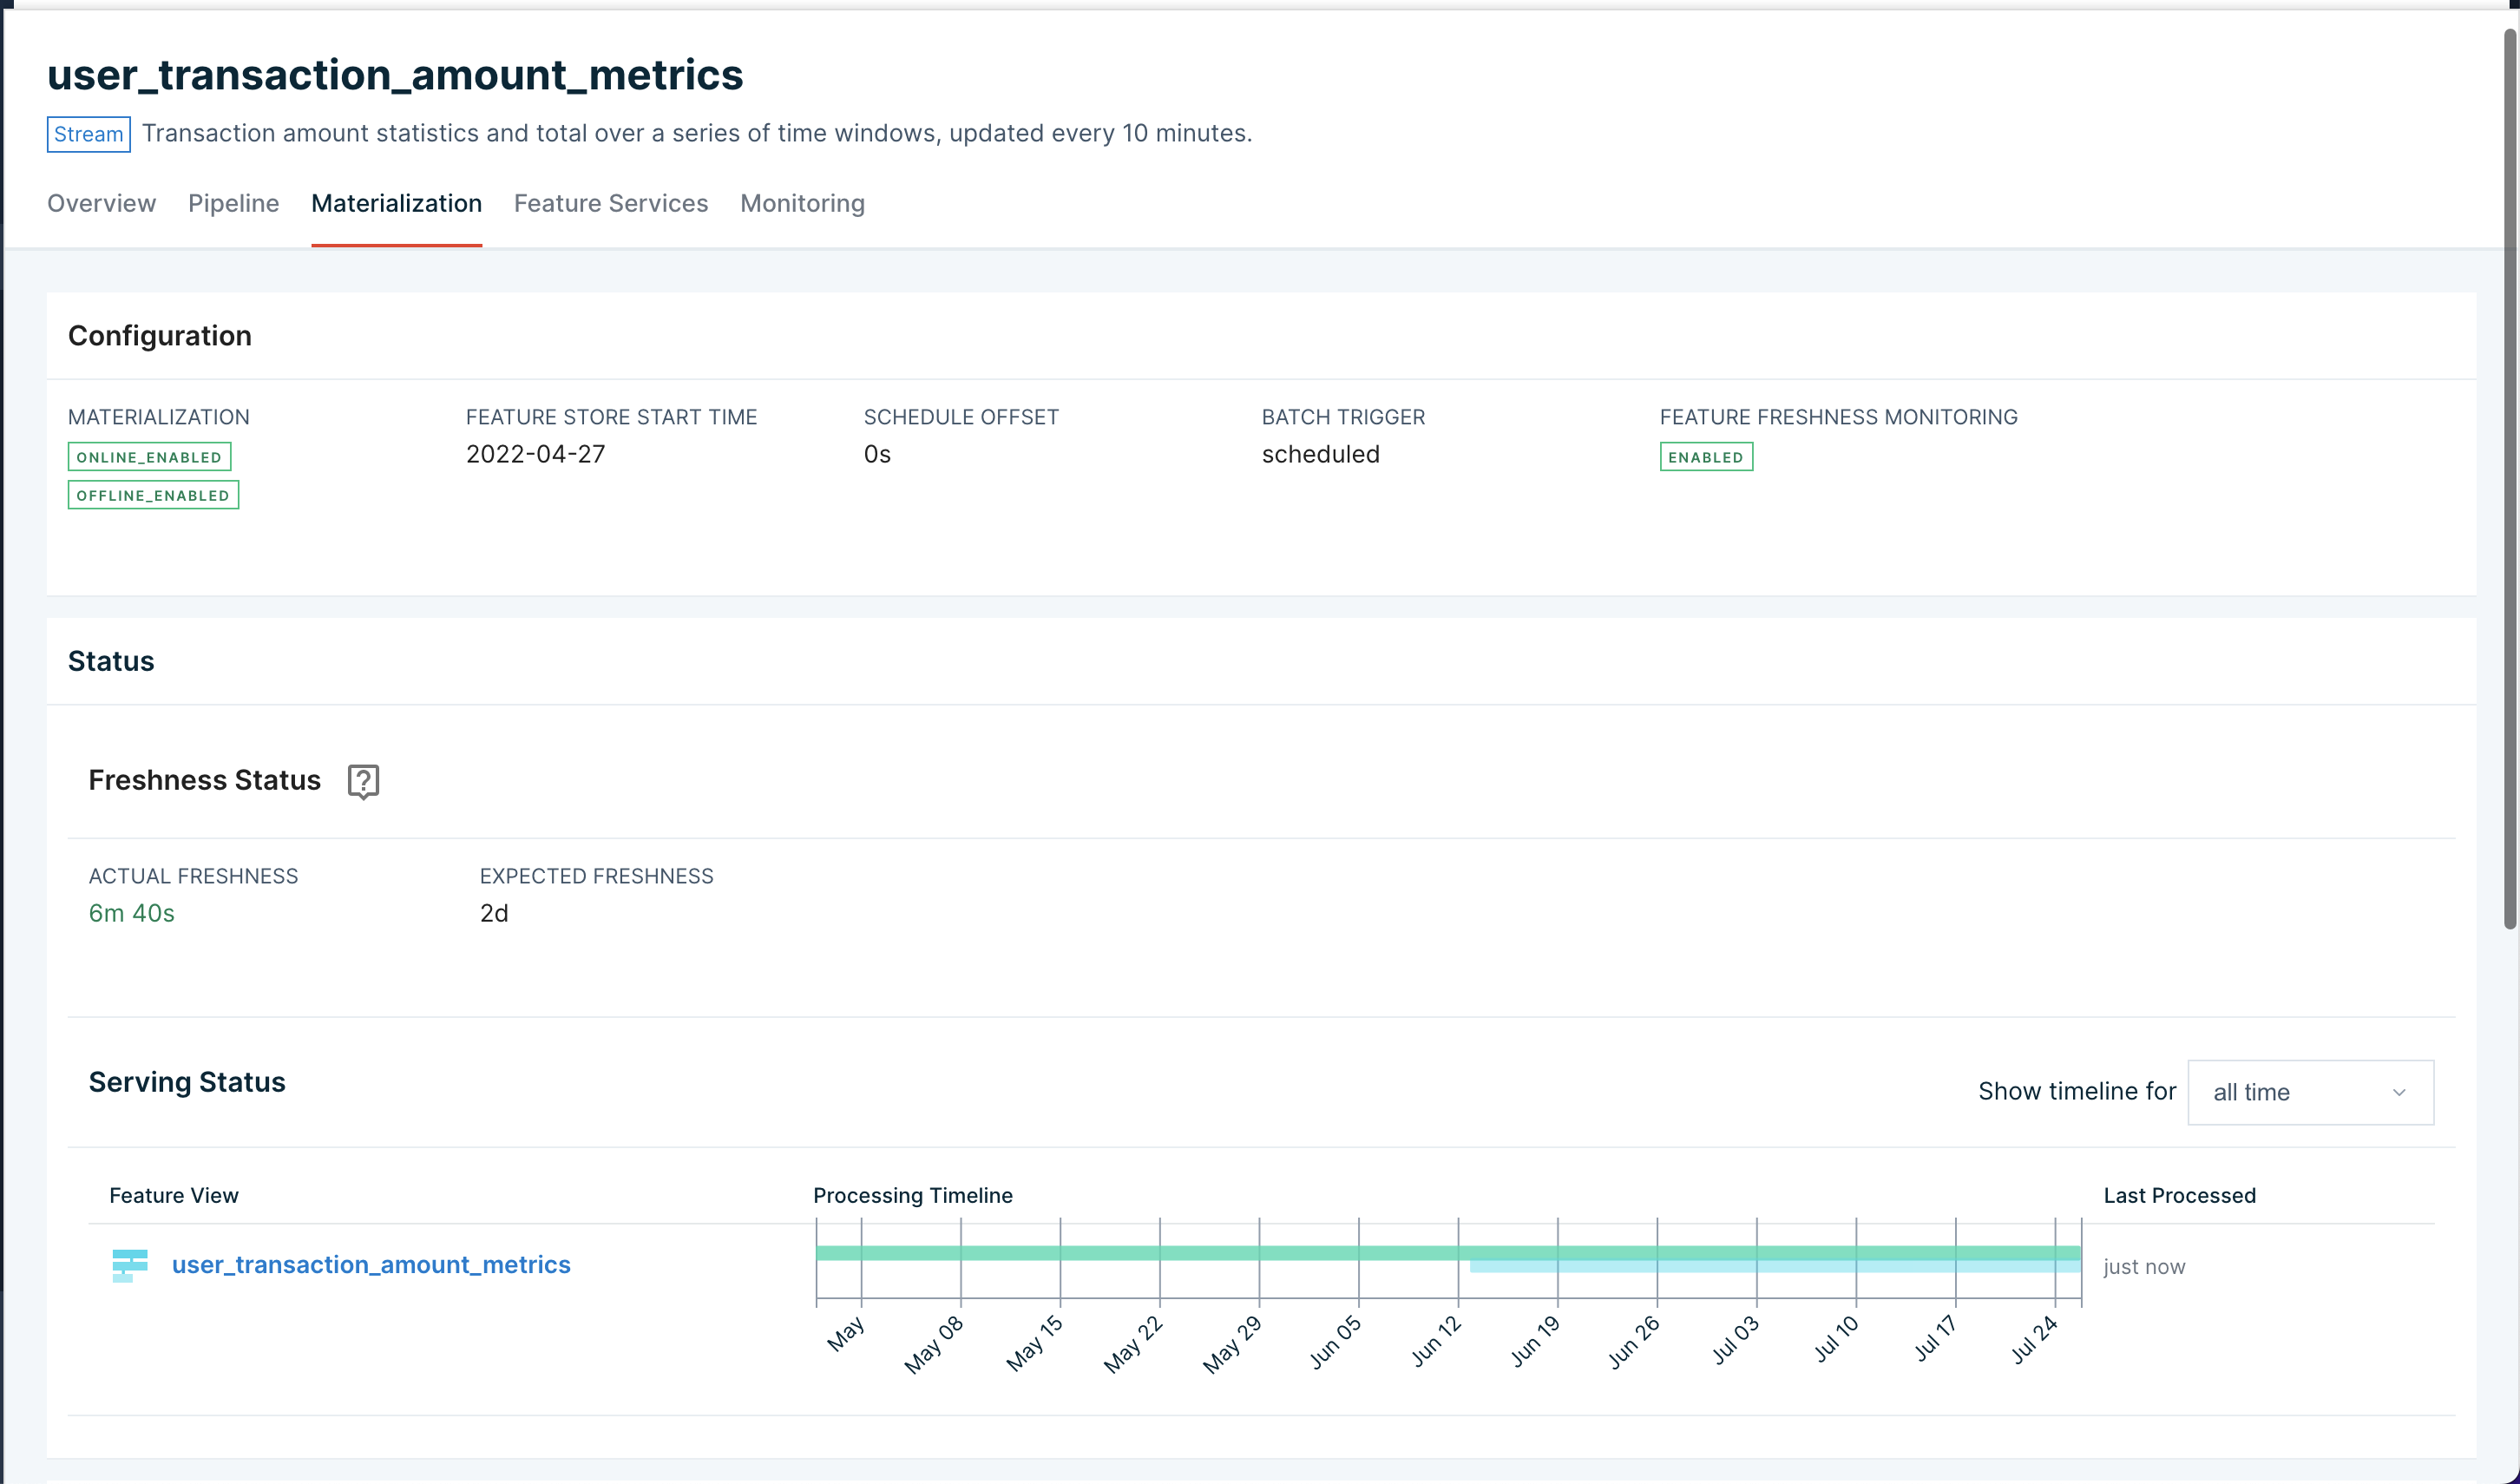
Web UI: Materialization tab
The Materialization tab for a Feature View contains information about expected and actual freshness for a Feature View along with a materialization timeline.
CLI: tecton freshness for all Feature Views
Tecton's CLI can return the status of all Feature Views using the tecton freshness command.
$ tecton freshness
           Feature View               Stale?   Freshness   Expected Freshness     Created At
=================================================================================================
partner_ctr_performance:14d              Y        2wk 1d      2d                   12/02/21 10:52
ad_group_ctr_performance                 N        1h 1m       2h                   11/28/21 19:50
user_ad_impression_counts                N        1m 35s      2h                   10/01/21 2:16
content_keyword_ctr_performance:v2       N        1m 36s      2h                   09/04/21 22:22
content_keyword_ctr_performance          N        1m 37s      2h                   08/26/21 12:52
user_total_ad_frequency_counts           N        1m 38s      2h                   08/26/21 12:52
Expected Feature Freshness
A Feature Views's freshness is expected to be less than twice its materialization schedule interval. This interval is determined using the aggregation_interval for Window Aggregate Feature Views or the batch_schedule for other Feature Views.
By default, alerts will fire once this threshold, plus a small grace period, is crossed. For streaming Feature Views, freshness can be configured as low as 30 minutes. The grace period's duration depends on the FeatureView's materialization schedule:
| Schedule | Grace Period |
|---|---|
| <= 10 minutes | 30 minutes |
| <= 30 minutes | 90 minutes |
| <= 1 hour | 2 hours |
| <= 4 hours | 4 hours |
| <= 24 hours | 12 hours |
| > 24 hours | 24 hours |
The table below has examples of materialization schedules mapped to default alert thresholds:
| Schedule | Default Alert Threshold |
|---|---|
| 5 minutes | 40 minutes |
| 30 minutes | 2.5 hours |
| 1 hour | 4 hours |
| 4 hours | 12 hours |
| 24 hours | 60 hours |
Alerts
Configuring Alerts
Tecton can automatically generate materialization health alerts and online store feature freshness alerts that are sent to a specified email address. There are different alerts for various materialization issues:
- Freshness Alerts
FeatureViewNotFresh
- Repeated Failures Alerts
FeatureViewBatchMaterializationFailuresFeatureViewStreamingMaterializationFailures
- Too Many Failures Alerts
FeatureViewTooManyFailures
Note
It is highly recommend that an alert email is set for each Feature View that is being consumed in production.
To configure alerts, specify alert_email and monitor_freshness in a MonitoringConfig object when declaring a Feature View.
from tecton import batch_feature_view, MonitoringConfig

@batch_feature_view(
  ...
  monitoring=MonitoringConfig(
    monitor_freshness=True, # required to enable alerts
    alert_email="ainsley@tecton.ai", # required alert recipient
    expected_feature_freshness="2w" # optional override
  )
)
def my_feature_view(inputs):
  ...
monitor_freshness: Set this toFalseto suppress online store freshness-related alerts.alert_email: Recipient of alerts. Must be an email address.expected_feature_freshness: See Expected Feature Freshness for details about the default value if this field is unspecified. This can be set to a longer duration if the default threshold is too low.
Freshness Alerts
Feature View data is considered stale when materialization is enabled, but new features are not being materialized. Tecton triggers a FeatureViewNotFresh when feature data becomes too stale based on the Expected Feature Freshness threshold, which can be overridden using the expected_feature_freshness parameter.
The most common causes of this type of alert are:
- Missing upstream data
- Errors in feature definitions that cause materialization jobs to either fail or produce no new feature values
- Outage or spot instance unavailability causing materialization jobs to fail
Repeated Failures Alerts
Tecton automatically schedules retries for failing materialization jobs using a retry strategy. Tecton will trigger an alert if these failures happen frequently. There are two types of repeated failure alerts:
FeatureViewBatchMaterializationFailures. Batch materialization jobs have failed 2 or more times.FeatureViewStreamingMaterializationFailures. Streaming materialization jobs have failed 2 or more times.
Note
Materialization jobs that need to be retried due to spot instance availability are not considered failures.
Too Many Failures Alerts
When materialization retries fail too many times, Tecton will move the Feature View to a "Too Many Failures" state and will not continue to retry materialization.
At this point, the FeatureViewTooManyFailures alert will be fired. This alert is most commonly caused by incorrect Transformation code.
Example: Debugging Alerts
This example details a possible triage and debugging process once an alert email has been sent for FeatureViewBatchMaterializationFailures.
The procedure has three parts:
- Navigate to the Web UI to examine recent Materialization attempts
- Dive into further details using the CLI.
- Examine cluster-level status information using the CLI.
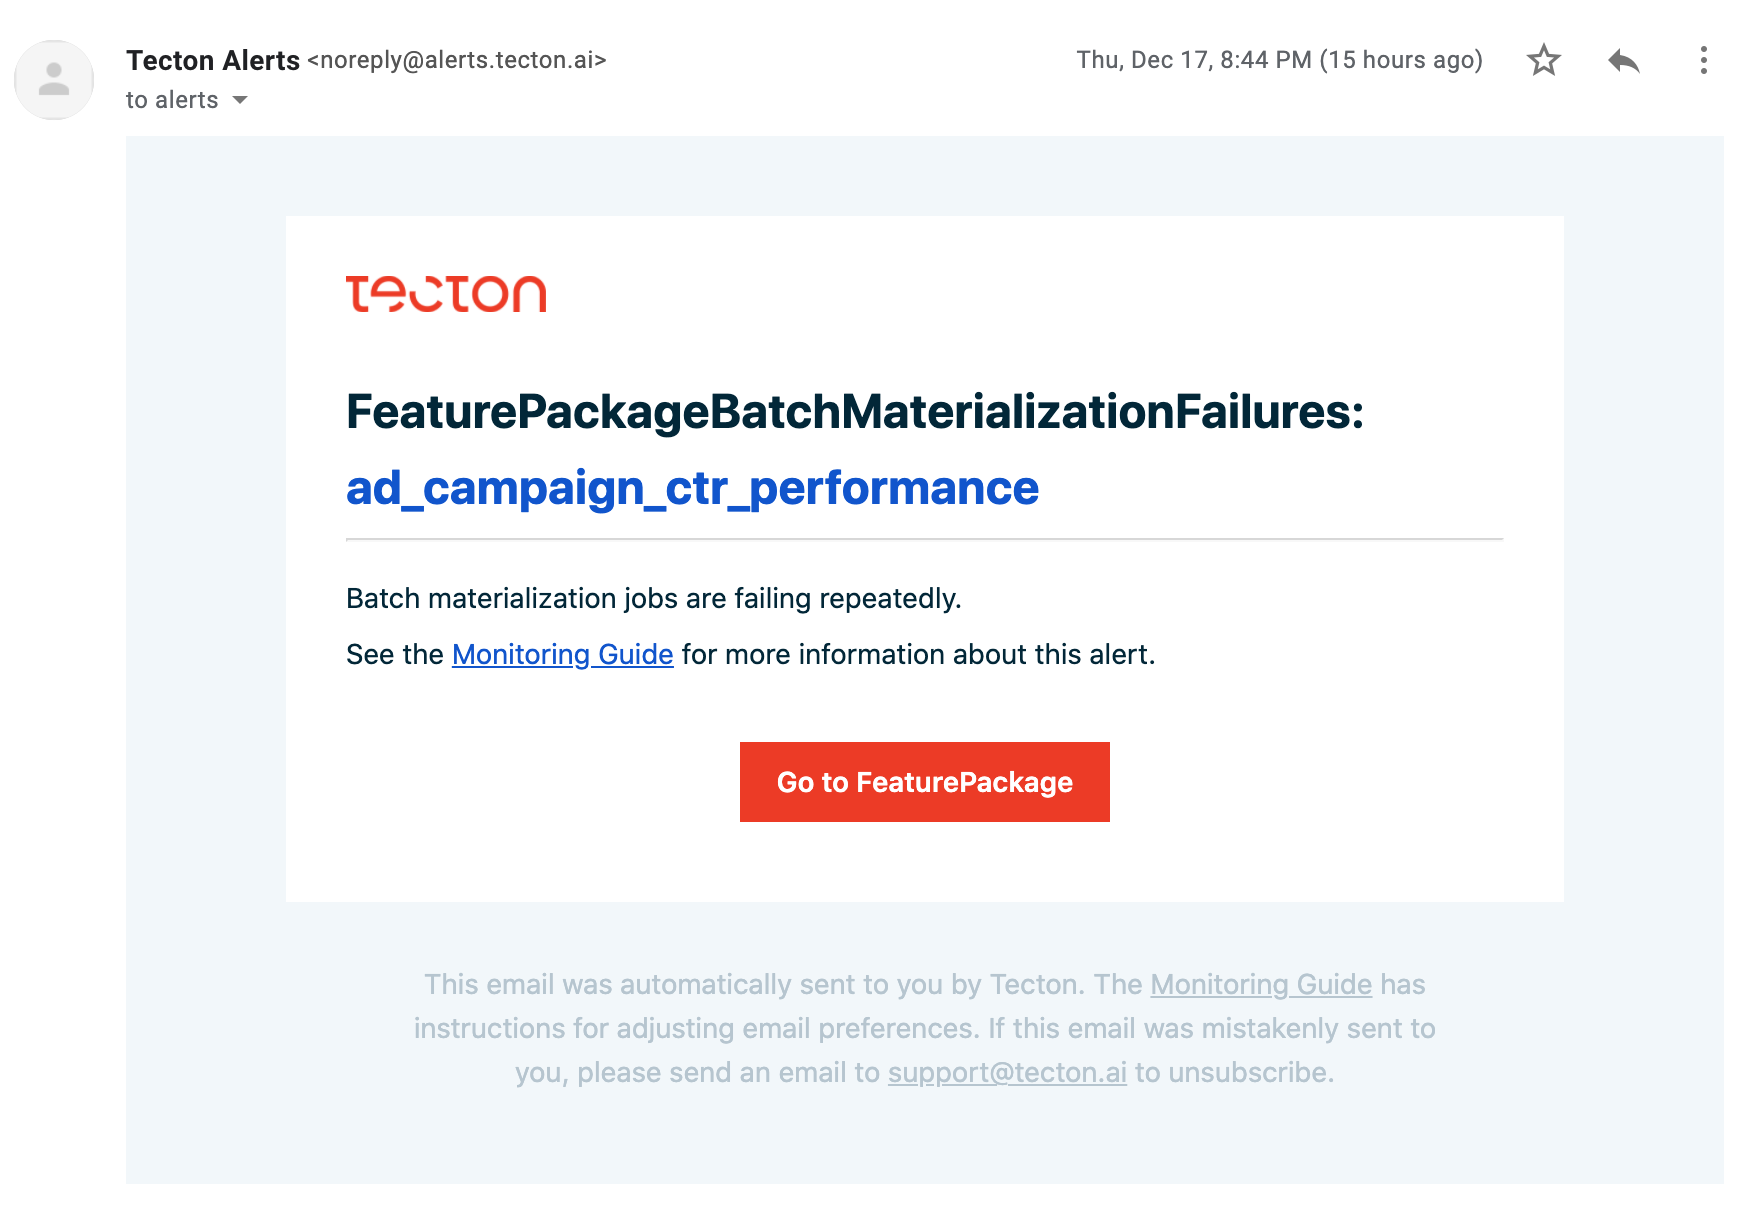
Email alert notification
Assuming you have already defined an alert_email in your Feature View's definition, you will receive an email alert when an error occurs. In this case, the error is FeatureViewBatchMaterializationFailures which refers to a failure with a batch materialization job.
Materialization Info in the Web UI
Click on the link in the email to view the alerting Feature View in Tecton's Web UI.
Navigate to the Materialization tab to explore materialization configuration and information about recent jobs.
If the Expected Feature Freshness is too low resulting in noisy freshness alerts, specifying a higher value for expected_feature_freshness might help. If the expected freshness is less than the actual freshness, the Feature View is considered to be serving stale data.
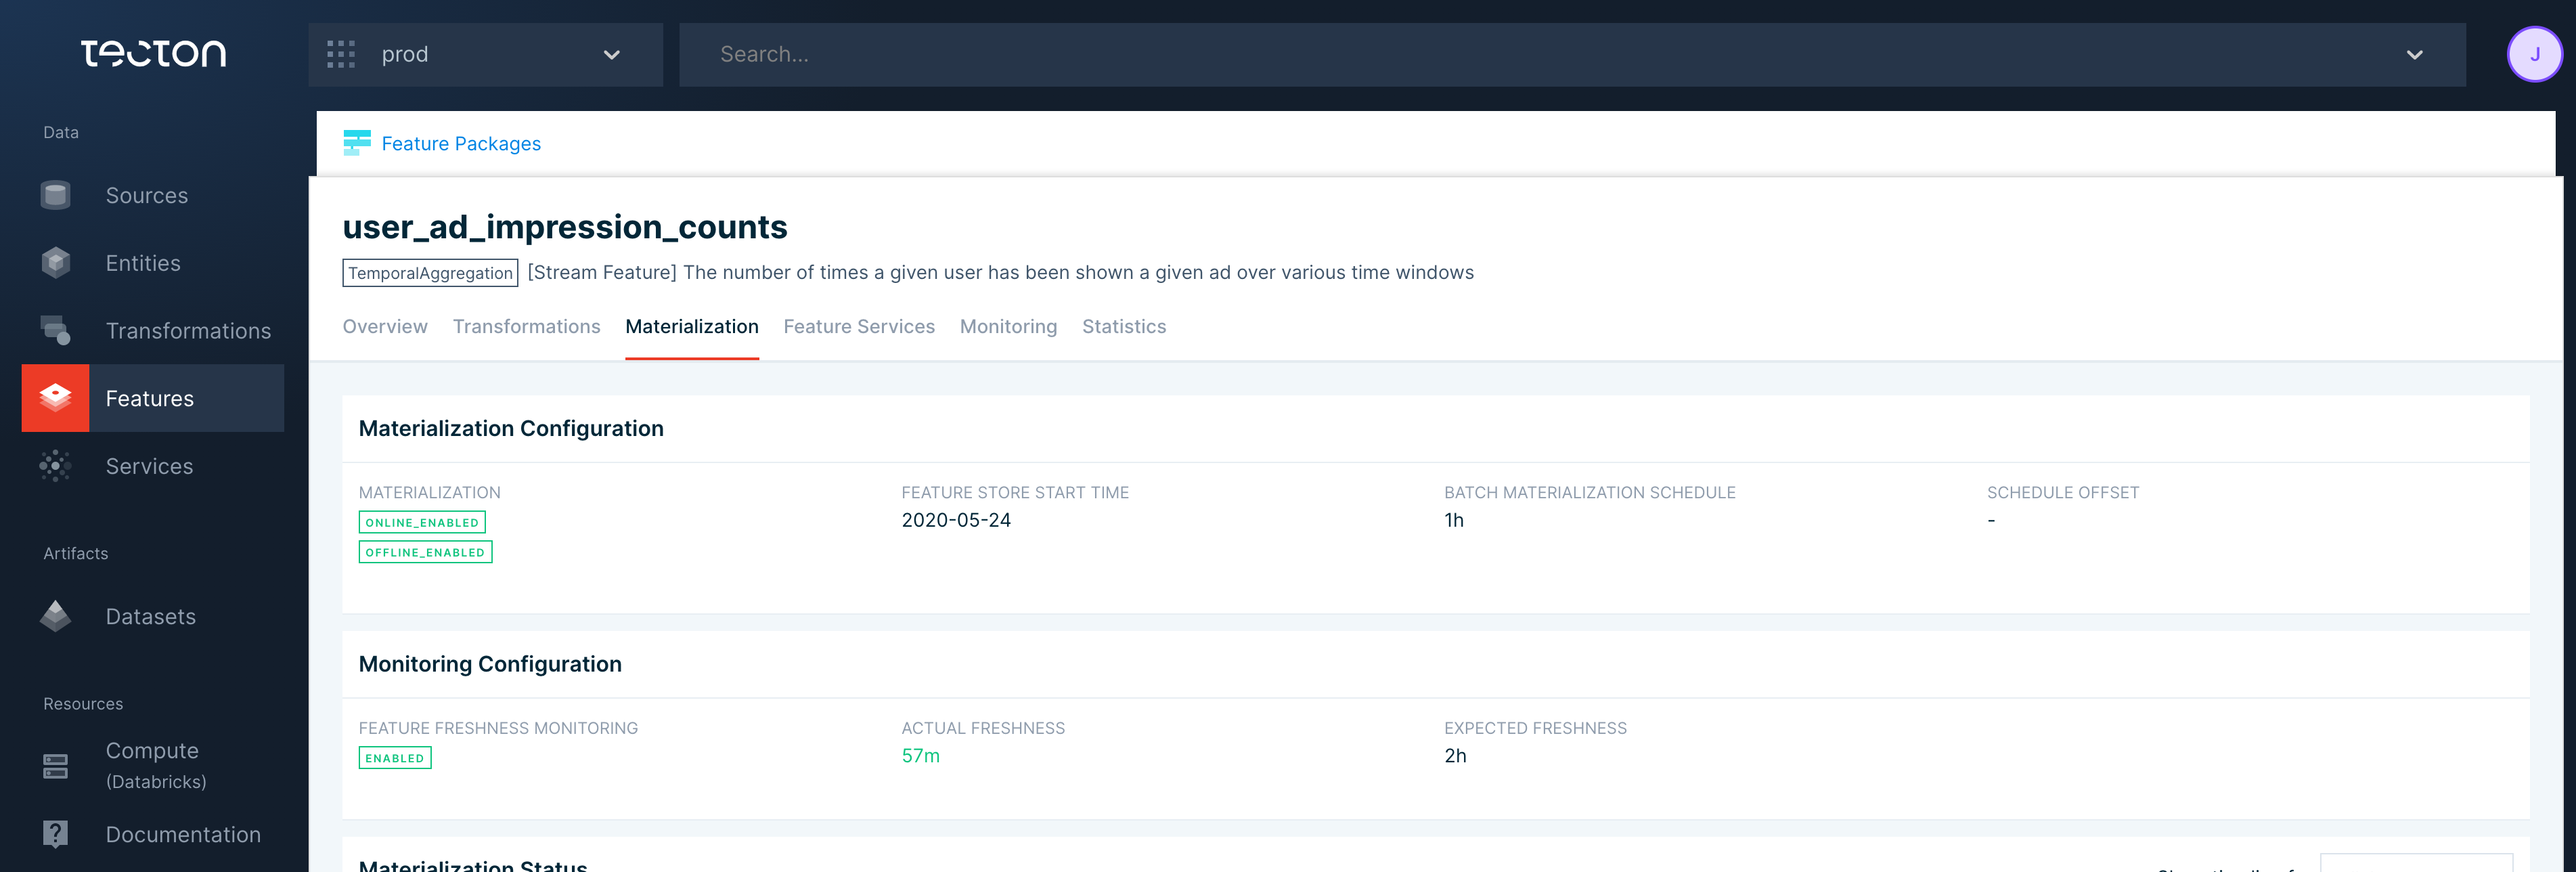
Scrolling down, use the "Materialization Status" and "Materialization Jobs" sections to help locate the source of the error.
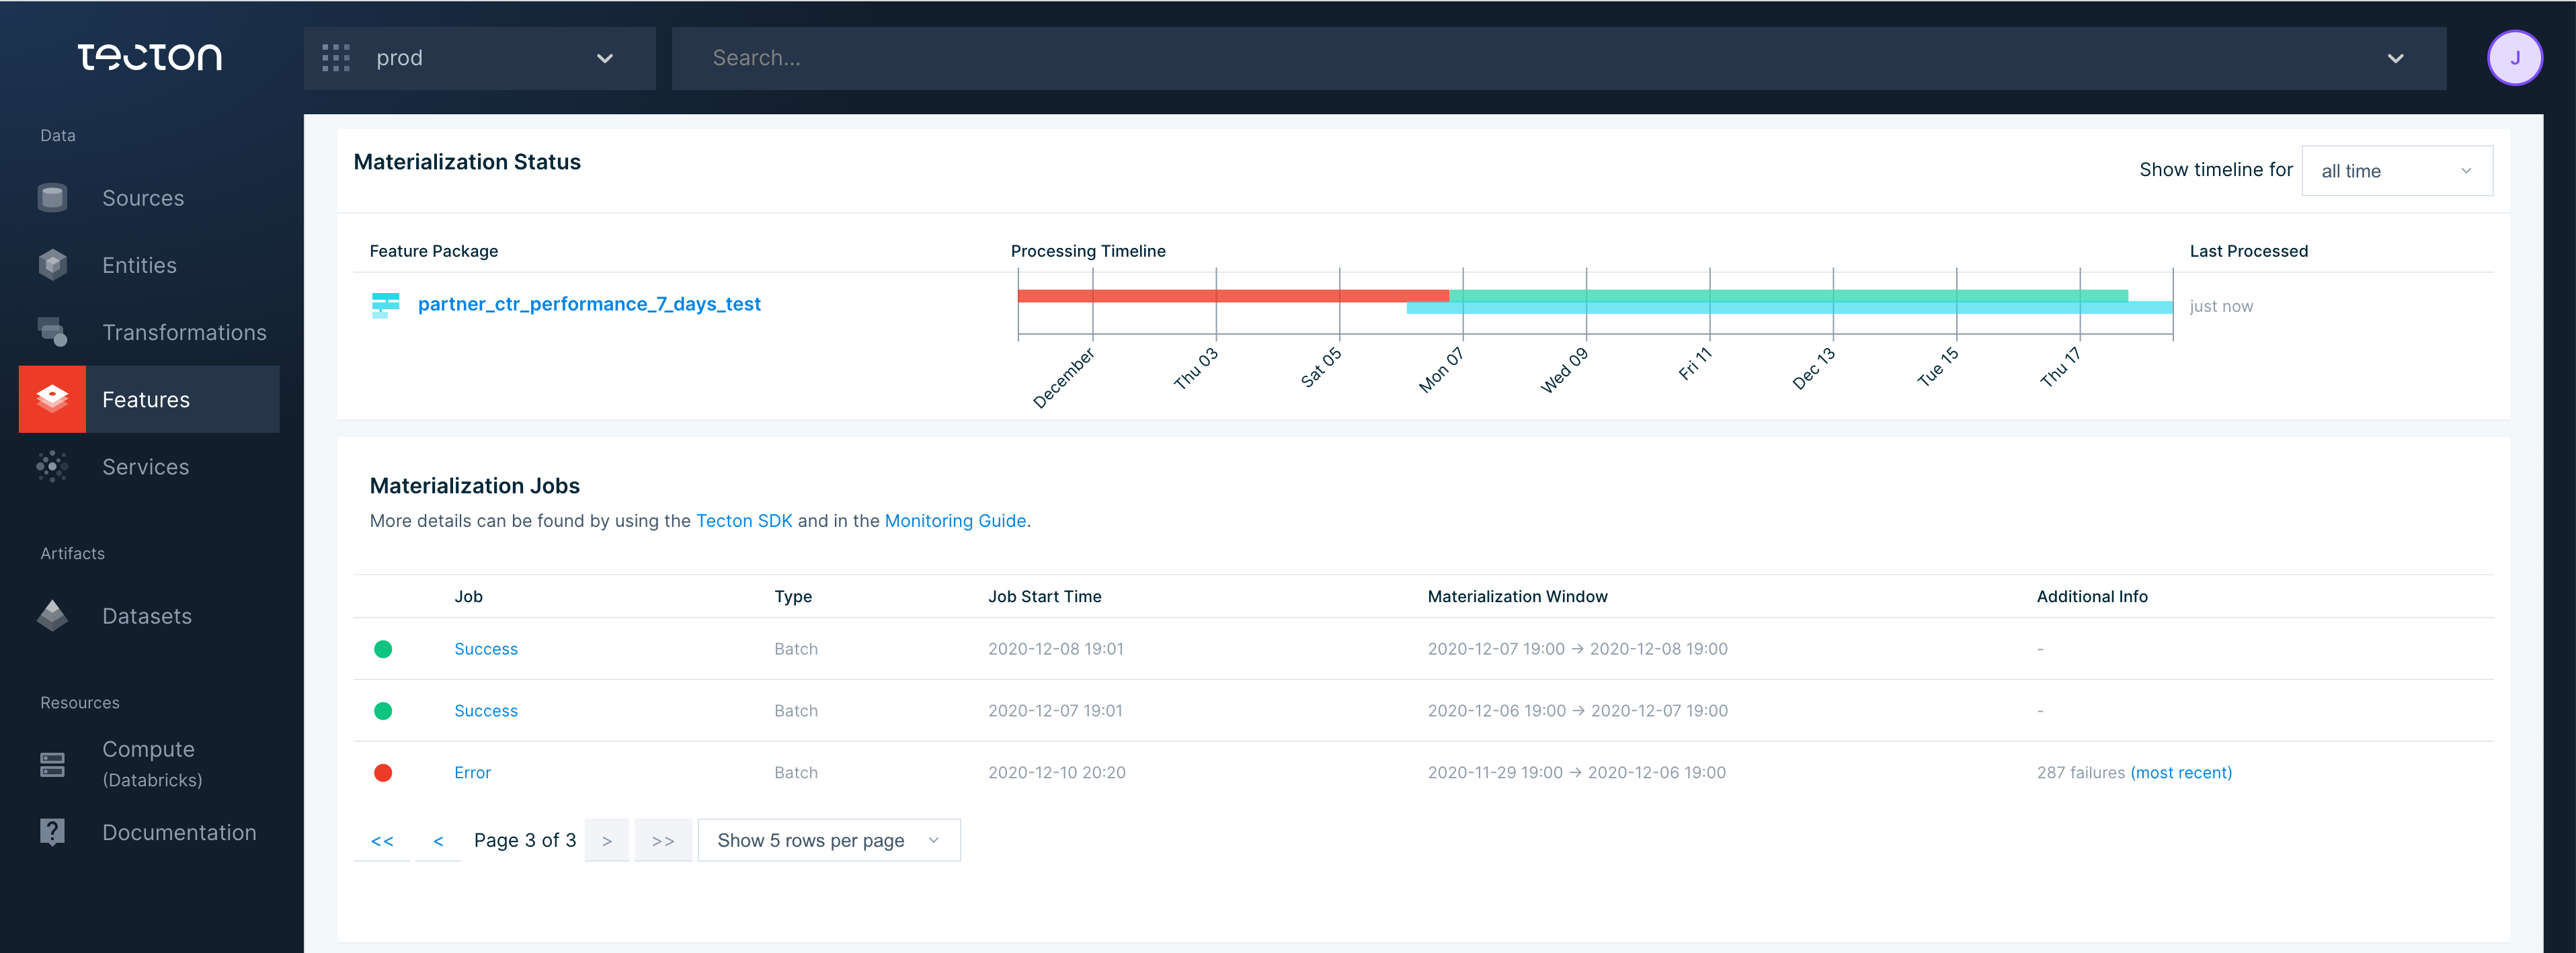
The Materialization Jobs table is often useful for locating individual errors. Click on the failing job link will take you to the failing job.
Note
Clicking on the failing job link is supported for Databricks jobs, but is not yet supported for navigating to EMR jobs.
Historical Feature View Materialization Jobs
If the materialization tab in the Web UI or its linked jobs did not provide enough information to debug the error, use the Tecton CLI or SDK to find more information.
From the Tecton CLI use tecton materialization-status [FEATURE-VIEW-NAME]. Use tecton materialization-status -h to display available flags.
$ tecton materialization-status ad_ground_truth_ctr_performance_7_days --limit=5
All the displayed times are in UTC time zone
TYPE     WINDOW_START_TIME      WINDOW_END_TIME     STATUS    ATTEMPT_NUMBER     JOB_CREATED_AT                                            JOB_LOGS
=========================================================================================================================================================================================
BATCH   2020-12-14 00:00:00   2020-12-21 00:00:00   SUCCESS         1          2020-12-21 00:00:14   https://...cloud.databricks.com/?o=3650800870221207#job/1772891/run/1
BATCH   2020-12-13 00:00:00   2020-12-20 00:00:00   SUCCESS         1          2020-12-20 00:00:13   https://...cloud.databricks.com/?o=3650800870221207#job/1772743/run/1
BATCH   2020-12-12 00:00:00   2020-12-19 00:00:00   SUCCESS         1          2020-12-19 00:00:10   https://...cloud.databricks.com/?o=3650800870221207#job/1772598/run/1
BATCH   2020-12-11 00:00:00   2020-12-18 00:00:00   SUCCESS         1          2020-12-18 00:00:06   https://...cloud.databricks.com/?o=3650800870221207#job/1772447/run/1
BATCH   2020-12-10 00:00:00   2020-12-17 00:00:00   SUCCESS         1          2020-12-17 00:00:13   https://...cloud.databricks.com/?o=3650800870221207#job/1772294/run/1
You can also view this information through the Tecton SDK by using:
import tecton
ws = tecton.get_workspace("workspace_name")
fv = ws.get_feature_view("feature_view_name")
fv.materialization_status()
Cluster-Level Freshness Information
If multiple FeatureViews in your cluster are stale, you can obtain an overview of top-level cluster information using tecton freshness. This is often caused by a common data source having no new data or an under-provisioned stream.
$ tecton freshness
           Feature View               Stale?   Freshness   Expected Freshness     Created At
=================================================================================================
ad_ground_truth_ctr_performance_7_days   N        14h 40m     2d                   10/01/21 2:25
user_ad_impression_counts                N        40m 24s     2h                   10/01/21 2:16
content_keyword_ctr_performance:v2       N        40m 25s     2h                   09/04/21 22:22
ad_group_ctr_performance                 N        40m 26s     2h                   08/26/21 12:52
ad_is_displayed_as_banner                -        -           -                    07/24/21 13:51