Managing Infrastructure Costs with Tecton
Because Tecton manages compute and storage infrastructure in your account, your organization will be charged for the resources used to process and serve features. This section shares some best practices for keeping infrastructure costs low.
Monitoring costs using tags
Tecton will automatically apply tags to ec2 instances and dynamo tables according to the relevant feature view. By default, Tecton will apply the following tags: tecton_feature_view, tecton_workspace, and tecton_deployment.
If you would like to associate FeatureViews with various cost-centers, you can add those as tags to your FeatureView definition. Tecton will pass through those tags to any ec2 instances or dynamo tables it manages associated with the feature view.
Limiting costs during new feature development
Model training often involves large amounts of historical data to get the best results. However we rarely get features right the first time, so we need to be careful about the amount of processing and storage we use while iterating on a feature.
Note that this section focuses on features that materialize data, such as a Batch Feature View. On Demand Feature Views don't incur much infrastructure cost within Tecton.
Begin in a development workspace
The safest way to validate the logic for a new feature is to apply it to your own development workspace. Development workspaces won't run any automatic materialization jobs.
For example, when working a new feature, you may want to switch to a blank development workspace.
$ tecton workspace create my_new_feature_ws
$ tecton apply
Once applied, you can use FeatureView.get_historical_features() to view sample output for the feature on recent dates.
import tecton

ws = tecton.get_workspace('my_new_feature_ws')
fv = ws.get_feature_view('user_has_good_credit_sql')

from datetime import datetime
from datetime import timedelta

# We need to use from_source=True because we don't have materialized data
fv.get_historical_features(start_time=(datetime.now() - timedelta(days = 7)), from_source=True)
Start with a recent feature_start_time
When you apply a Feature View to a workspace with automatic materialization enabled, Tecton will automatically begin materializing feature data back to the feature_start_time.
It's usually a good idea to begin with a recent start time to avoid processing a lot of historical data before you've validated that this is the right feature. For example, you may start with a week to confirm the feature output is correct and inspect how long the jobs take to complete. Next you can backfill 2 months to evaluate the performance impact on a limited set of data, and finally backfill the full 2 years once you think it is a valuable feature.
When you extend the feature start time further back, Tecton intelligently only materializes the new dates. For example, let's say you begin with feature_start_time=datetime(2021,1,1) . Tecton will begin with backfilling all the data from 2021-01-01 up until the current date. If you then change to feature_start_time=datetime(2019,1,1) to train a model with the full history, Tecton will then only compute the data from 2019-01-01 to 2021-01-01.
Using AWS Cost Explorer, you can see the cost impact of the backfill by looking for resources with the tecton_feature_view tag.
Keep online=False until you're ready to serve online traffic
When a feature view is configured with online=True, Tecton will materialize data to the online store for low latency retrieval.
Online stores are optimized to provide the low latency access needs of production applications, but are an expensive place to store data.
To keep costs low you should avoid writing data to the online store until you are ready to serve data in production. For example, you may only materialize data offline while training and evaluating a model, then set online=True when you're ready to deploy my model to production.
While changing from online=False to online=True will require reprocessing historical data, the extra compute cost is typically much less than the potential cost of backfilling to the online store twice.
Monitor materialization status, especially during backfills
Tecton will automatically retry failed jobs in case of transient issues, such as spot instance loss. However it's a good idea to keep an eye on any failures in case it is unlikely to be solved by a retry, so that you can cancel them before they are run again.
By setting your email in a MonitoringConfig, you'll get an email if there are repeated failures. You can additionally check in the Web UI to see how jobs are proceeding.
Note that simultaneously backfilling many feature views to the online store has been known to cause jobs to fail. Although Tecton will retry them automatically, you may want to pause some feature view backfills while others complete.
Optimizing Spark Cluster Configurations
Streaming Cluster Configuration
Costs can add up quickly for streaming features because the Spark cluster is always running. If you have many streaming features, setting these options correctly will have the largest impact on your compute usage with Tecton.
If stream_cluster_config is not set, then Tecton will use a default instance type and number of workers. You will likely want to adjust this default to fit your production workload. Either the cluster will be under-provisioned and lead to delayed features, or be over-provisioned and cause unnecessary costs.
How to tell if your stream cluster is over-provisioned
In short, we want to understand if the Spark cluster used for the stream processing job has excess compute or memory.
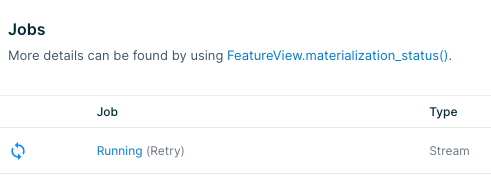
You can find the stream job associated with a feature by clicking on the Running link in the Job column in the materialization tab for the feature. This will link you to job info with your Spark provider.
From there you can find the Ganglia metrics for compute or memory usage. If the charts show that the resources are way underutilized (e.g. CPU is 98% idle), then you can safely reduce costs by specifying the number of workers or instance types for your stream_cluster_config.
Batch Cluster Configuration
Batch processing doesn't have as much room for cost optimization as stream processing because the clusters terminate as soon as the job is done. Decreasing cluster resources may cause the jobs to take longer and offset any cost savings.
That said, you can still inspect the job logs through the link in the materialization tab shown above. If your jobs are finishing very quickly (say, less than 15 minutes), you may be spending an unnecessary amount of time spinning up the cluster and could benefit from reducing the number of workers.